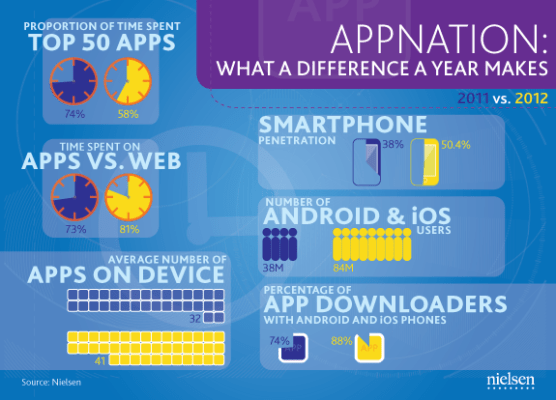
With smartphone penetration now at 50 percent in the U.S., the world of apps is seeing a knock-on effect in their popularity: according to a new report from Nielsen, mobile consumers are downloading more apps than ever before, with the average number of apps owned by a smartphone user now at 41 — a rise of 28 percent on the 32 apps owned on average last year.
But at the same time, there are hints of people possibly approaching a limit to how much they might use them: despite the rise in app numbers, the amount of time that people are spending in apps has remained essentially flat: collectively, they are being used for 39 minutes per day today, compared to 37 minutes in 2011.
Nielsen also notes that apps seem to be taking a bit of time away from mobile web usage (perhaps this is where the extra two minutes comes from…): it says that users are using apps 10 percent more than the mobile web, compared to last year.
As for why users are spending no more time on apps than they were before: Nielsen doesn’t really explore that issue, but it does note that privacy has slightly increased as an issue for U.S. consumers: some 73 percent note personal data collection as a concern (compared to 70 percent a year ago), with 55 percent saying they are wary of sharing information. It could be that this privacy concern is actually keeping at least some people away from engaging in apps more.
Going back to the increase in app downloads noted by Nielsen, this is something that has been pointed out by the app store owners in a different way: Google says it has now passed 15 billion downloads announced this month, and Apple noted 25 billion downloads in March 2012.
This morning, Gartner released some figures that pointed to even more consolidation among the top handset makers and the top platforms — with Samsung and Apple accounting for 49.3 percent of all smartphones sold in Q1 2012 (compared to just under 30 percent a year ago).
Nielsen’s app figures seem to point to a similar trend: Android and iOS owners accounted for 88 percent of all apps that were downloaded in the past 30 days, it says (up from 74 percent last year). That may partly be to do with their own market share size in the U.S., where Android and Apple’s iOS dominate the smartphone landscape with respectively 38 million and 84 million users — but it also seems to imply that those users are also actively engaging with their respective app stores.
The other significant consolidation trend that Nielsen has picked up on is around what apps are actually getting the most traffic: even as app stores have grown, and our own collections of them have grown, we continue to fixate most on the exact same five apps this year as we did last year: they are Facebook, YouTube, Android Market, Google Search, and Gmail.
Yes, that’s right: you can slam Google, Android and Android fragmentation all you want, but four of the five most popular apps today, as they were last year, are owned by the company, and that’s partly thanks to the popularity of three of them on iOS.
Ironically, that concentration at the top is also being met with growth in long-tail consumption: Nielsen notes that the time spent on the top 50 apps is actually down compared to last year: the top 50 apps today get 58 percent of our app time, compared to 74 percent in 2011. As with our own personal app catalogues growing in size, this points to consumers getting more diverse in terms of what apps they are using overall, not a surprise really when you consider that there are around 1.1 billion apps currently between just Google Play and the Apple App Store.
